After years of working in agile software development and becoming certified as a PMP and Scrum Master, I've come to realize that agile metrics are both distinct from and complementary to product and business metrics. Agile metrics primarily serve the internal needs of the team and act as a starter of conversation for continuous improvement. In an iterative scrum setting, these metrics gauge productivity and the quality of each sprint and release and support overall business OKRs.
Before diving into specific metrics, let's agree on what constitutes good metrics:
Relevant and Workflow Aligned: Metrics should be aligned with your product and sprint/release workflows. They should directly contribute to achieving project goals.
Clearly Defined and Easy to Measure: Definitions should be clear and agreed upon by the team. Metrics reporting should be automated where possible, and dashboards should provide real-time visibility into performance.
Evaluated Together and Actionable: Metrics should be discussed collaboratively during sprint planning meetings and retrospectives. The team should identify areas for improvement and assign owners to take action to address issues.
Here are seven key metrics you can consider for your agile projects.
Productivity metrics
Sprint burndown chart
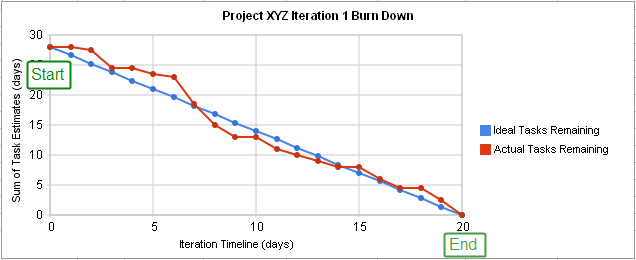
Since a sprint is time-bound, it’s important to track task progress frequently. A sprint burndown chart tracks the completion of work throughout the sprint. The x-axis represents time, and the y-axis refers to the amount of work left to complete, measured in either story points or hours. The goal is to have all the forecasted work completed by the end of the sprint.
Things to watch out for:
Finishes the sprint earlier, may be the team is not committing to enough work, potentially impacting project deadlines.
Misses sprint timeline, may be the team is committing to too much work, leading to quality compromises or burnout.
The burndown line makes steep drops, maybe the work hasn't been broken down into granular pieces, making it difficult to track progress accurately.
A sudden increase in the burndown slope could indicate scope creep, requiring careful management to avoid impacting project timelines.
Release burndown chart
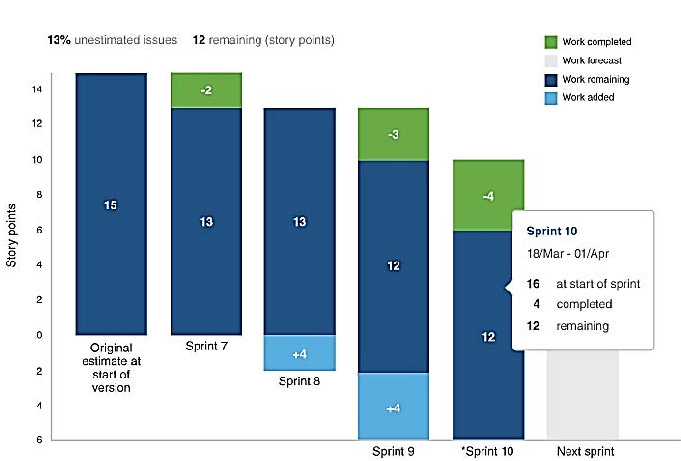
Normally, there are many epics and versions of work in a sprint. The release burndown chart tracks the progress of epics and versions throughout the project, providing a holistic view of workflow and helping the team stay on track.
Things to watch out for:
No progress is made over a period of several iterations, may indicate underlying issues with project planning or execution.
Chronic scope creep, may be a sign that the product manager doesn't fully understand the problem, may increase complexity and compromise quality.
Scope grows faster than the team can absorb it, may strain resources and lead to delivery delays.
The team isn't shipping incremental releases throughout the development of an epic which may hinder stakeholder feedback and prevent early validation.
Velocity
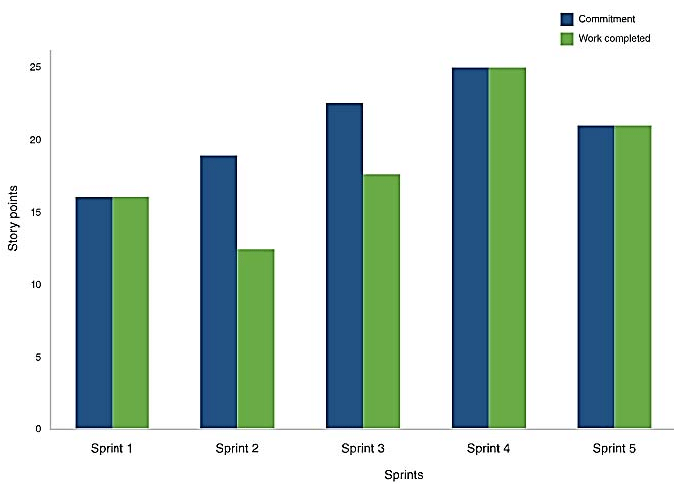
Velocity measures how many story points were completed by a team, on average, over the past few sprints. It can be used to predict the team’s output in the upcoming sprints.
Things to watch out for:
If completed points below committed points happened repeatedly, may indicate business pushes the team beyond its limits; or over optimistic in estimating the capacity
A decrease in average velocity is usually a sign that the team's development process has become inefficient and should be brought up at the next retrospective.
Each team's velocity is unique and should be used for internal benchmarking rather than direct comparison with other teams.
Cumulative flow diagram (CFD)
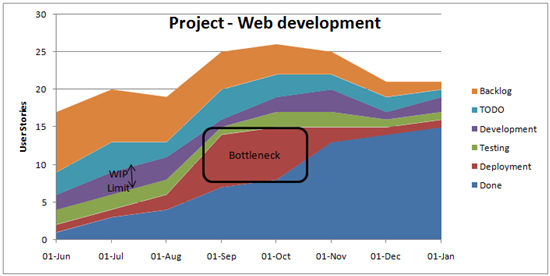
It is a important Kanban diagram, a graph that tracks the number of work items at different stages (i.e. done, to do, and in progress) of the development cycle at any given point.
The y-axis represents the number of stories whereas the x-axis represents your time frame. A smooth cumulative flow diagram indicates that the amount of work done from one point in time to the next is consistent, whereas wider gaps indicate the presence of bottlenecks that make your team’s output inconsistent and unreliable.
Things to watch out for:
Large backups in certain stages of the process may indicate underlying bottlenecks or resource constraints that need to be addressed.
Unchecked backlog growth may indicate the product manager isn't closing issues promptly or including less prioritized items, which can lead to project delays and decreased team efficiency.
Quality metrics
Code coverage
Code coverage measures the percentage of your code which is covered by unit tests. Code coverage can be run automatically as part of every build and gives a crude picture showing how much of the codebase has been tested. A low code coverage almost always indicates low code quality.
Things to watch out for:
It is possible for developers to put in useless tests in an attempt to game the system and score higher on code coverage.
However, a high coverage may not equal high quality. There are issues that you simply can’t identify in unit test.
Escaped Defects
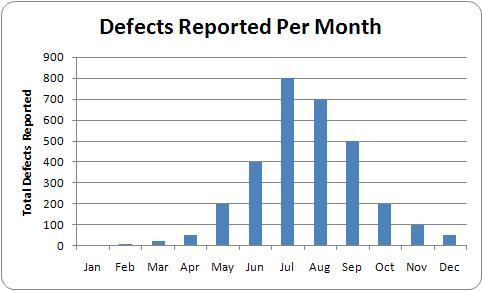
Escaped defects metrics help in bug identification when a release enters production. When there are bugs in production, it causes a lot of damage. The later a bug is identified, the higher cost it is. In payment business, it could be consumers can’t pay and merchants can’t be paid. Or business operations like billing and reconciliation is disrupted by missing and wrong data. The entire team needs to address them in emergency, which disrupts new sprints progress and lowers the morale of the team.
Ways to improve:
Rigorous testing practices, including integrated tests, regression tests, and user acceptance tests, can help catch defects early in the development process.
Adoption of continuous development/integration (CD/CI) practices in DevOps facilitates frequent releases and faster defect resolution.
Understanding what and why, identify root causes of software defects such as lack of collaboration, poor code coverage, and inadequate testing.
Meantime to recover (MTTR)
While we improve quality and monitor the trend of defects escape, we know in real life some defects will get into production for various reasons. That is the reason we need to measure - Mean Time To Recover (MTTR). It refers to the average amount of time it takes to recover from an issue or failure in a system, equipment or process. It is a lagging indicator that shows you how quickly a service can resume normal operation after an interruption. Usually, the more mature a product is, the shorter MTTR is.
Factors to consider:
Severity scoring helps prioritize bug fixes and allocate resources effectively, ensuring that critical issues are addressed promptly.
Triage processes streamline defect resolution workflows, minimizing downtime and mitigating the impact on customers.
Final thoughts
It is crucial to select key metrics that align with the product's goals and provide valuable insights into team performance and progress. In summary, agile metrics should be:
Choose Relevant Metrics: Select metrics that focus on productivity, quality, and progress without overwhelming the team.
Metrics Integration: Ensure that Agile metrics work together with other relevant metrics to provide a balanced view of the project's performance.
Team Involvement: Agile metrics should be utilized by the Agile team members themselves for improvement rather than being imposed by outsiders.
Promote Discussions: Agile metrics should serve as conversation starters within the team. Encourage discussions during sprint planning meetings and retrospectives based on the insights provided by the metrics
Continuous Improvement: Use Agile metrics to identify areas of strength and weakness in the project. Leverage these insights to address bottlenecks, enhance predictability, and maintain a focus on product quality throughout the development process
By incorporating these steps into your Agile project management approach, you can leverage Agile metrics effectively to optimize project delivery, enhance team performance, and drive continuous improvement in your projects.
Reference
Terms
Agile: An iterative approach to software development that helps tackle projects more efficiently by breaking them down into smaller tasks.
Scrum: A structured framework used by agile project managers and development teams to improve performance through continuous feedback.
Sprint: Sprints are time-boxed periods where development teams try to complete a set amount of work
Story: User stories or story points are the smallest unit of work in the agile methodology, used to refer to a single feature or bug that has to be tackled by the development team.
Backlog: A complete list of deliverables for any given project, sorted in order of priority.
Kanban: A visual framework for managing work in the correct order of priority.
DevOps: A set of practices that unites development and operations teams for better management of the entire software lifecycle.
Integrated test: Testing the interactions between different components or modules of a software system
Regression test: Testing that verifies that a recent code change has not adversely affected existing features
User acceptance test: Users creating real-world situations and testing how the software reacts and performs
Resources
Three Pillars of Scrum: Understanding Scrum’s Core Principles
Five agile KPI metrics you won't hate
https://blog.cycloid.io/7-platform-engineering-kpis-you-should-be-tracking
https://www.plutora.com/blog/agile-metrics
https://arkenea.com/blog/agile-metrics/
https://www.splunk.com/en_us/blog/learn/mttr-mean-time-to-repair.html


